
The auto industry has been under tremendous pressure for up-gradation of vehicle standards since last year. In 2014, the emphasis was on regularisation of minimum safety standards on four and two wheelers; post which the government body acted accordingly and sculpted few regulations, which are set to come in effect in a couple of years from now. Coming to this year, the National Green Tribunal irked vehicle owners by banning old vehicles which are more than a decade old in the NCR region sighting the need to reduce emissions.
Hence MotorBeam started digging out information to see which city stands where in terms of pollution, and to emphasise if similar actions pertaining to NCR should be extended! Air is polluted by many gases and substances that emerge out from the exhaust pipes. We decided to map out three major pollutants NOX, SO2 and PM 2.5 across few Indian cities. You all might know what the first two gases are, hence let me give an introduction of PM 2.5. PM 2.5 is particulate matter (size less than 2.5 μm) which is a part of soot that comes out from exhausts gases. The below comparison is done for 8 cities from a period of 2010 to 2015 for the major cities where BS4 is already implemented.
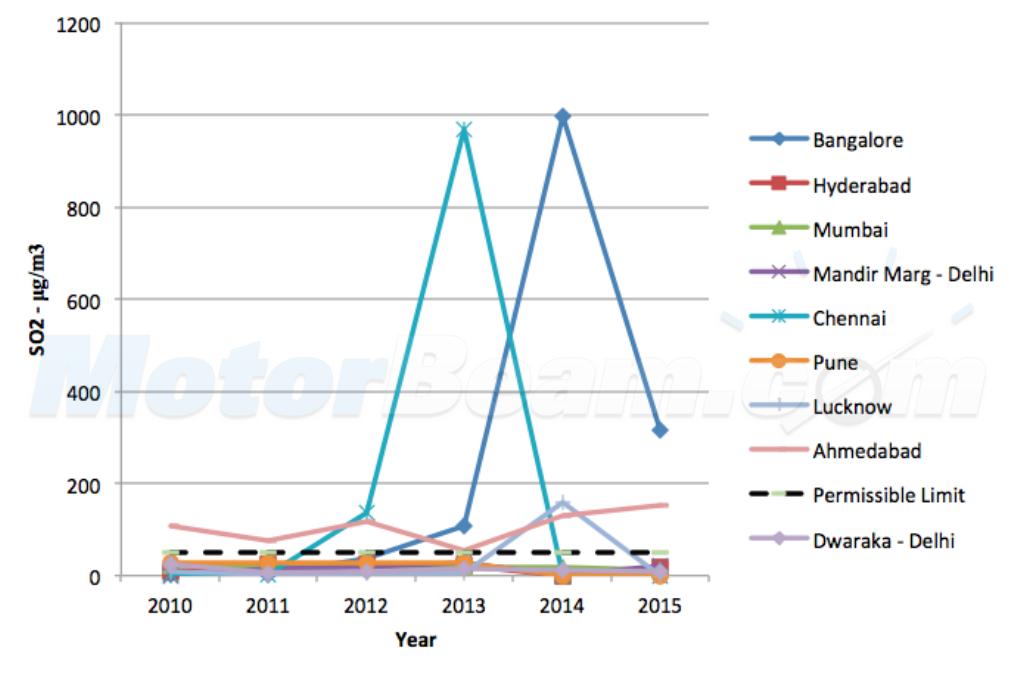
SO2 though may not be an imminent threat but is certainly going to make a huge impact in the near future in the form of acid rain. Though SO2 is mainly contributed by industries, vehicular pollution also plays an important role. That is the reason the whole country is upgrading from BS3 to BS4 where the sulphur content is reduced from 350 PPM to 50 PPM; while BS5 fuel would be containing just 10 PPM. Less the sulphur in fuel, lesser would be the sulphur related pollution.
Topping the list for the most polluted city (in the compared ones) for SO2 is Bangalore and is followed by Chennai. As per permissible limit set by Central Pollution Control Board (CPCB), the SO2 content in air should be less than 40 μg/m3. Last year Bangalore (BTM, a residential area) recorded an average reading of 996.5 μg/m3 while Chennai (IIT Madras area) recorded 967 μg/m3 in 2013; which accounts that Bangalore and Chennai air has been about 25 times more polluted than the permissible limit. Ahmedabad made sure that it made to the podium as the city’s SO2 levels constantly loitered above the danger limit for 5 continuous years. Surprisingly Delhi’s air contained an average of 15 μg/m3 over the last 6 years.
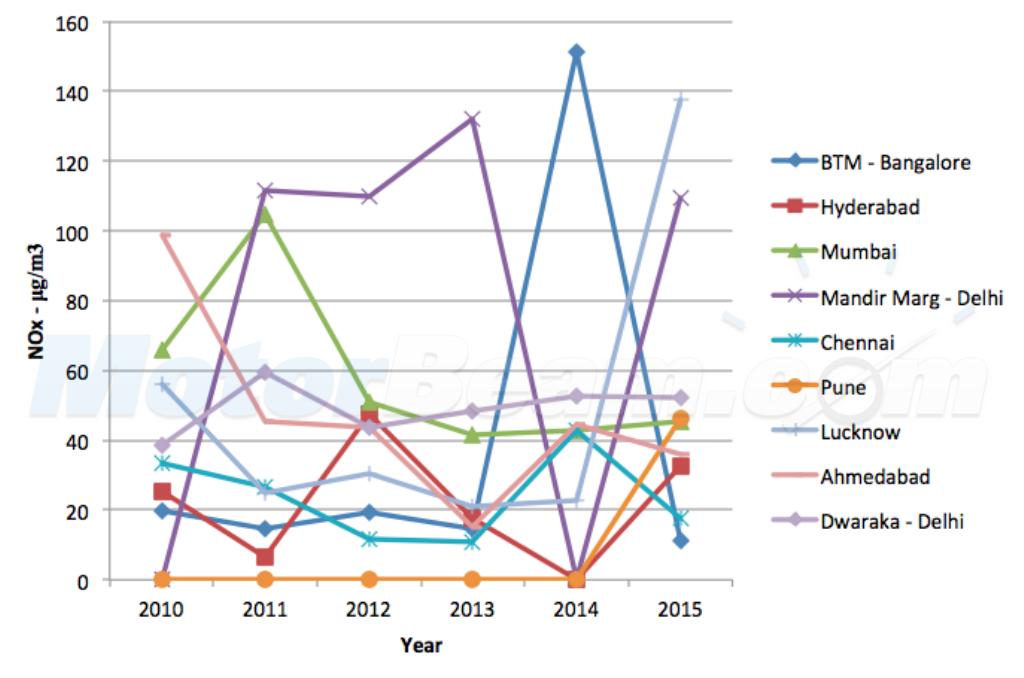
NOX – NOX is an important pollutant generated by petrol and diesel mills, which is mainly generated due to the high temperature generated in the combustion chambers (inside piston cylinder arrangement). So how is NOX emissions related to pollution? NOX comprises of NO and NO2 which are one of key contributors to green house gases and acid rain. BS4 is by large a stricter emission norm and calls for a reduction in NOX emission which can currently be done by adding Exhaust Gas Recirculation (EGR) systems to engines.
Adding EGR reduces the overall efficiency of an engine in terms of performance but by re-circulating a little amount of exhaust gas (which replaces air) to the combustion chamber, the total heat generated is reduced (as the oxygen content is less because air is mixed with exhaust gas) hence NOX emissions reduce. Now CPCB hasn’t provided data related to permissible limit in air but we did the comparison for the major cities.
As per the collected data, Bangalore again tops the list with 151 μg/m3 in 2014 while the second and third places are occupied by Lucknow and Delhi respectively. Delhi is comparatively on the higher side for containing NOX content in air when consolidated for 6 years and is trailed by Mumbai and Ahmedabad on the long term chart.
PM 2.5 – The most important of all is the particulate matter (size less than 2.5 μm) that causes severe problems to the human respiratory system. When you inhale, you breathe in air along with any particles that are in the air. The air and the particles travel into your respiratory system (your lungs and airway). Along the way, the particles can stick to the sides of the airway or travel deeper into the lungs. Being extremely light in nature, PM 2.5 travels deeper into the lungs and is made up of things that are more toxic (like heavy metals and cancer causing organic compounds). PM 2.5 can have worse health effects than the bigger PM 10. As per permissible limit set by CPCB, the PM 2.5 content in air should be less than 40 μg/m3. In 2015 the particulate matter content stands as follow –
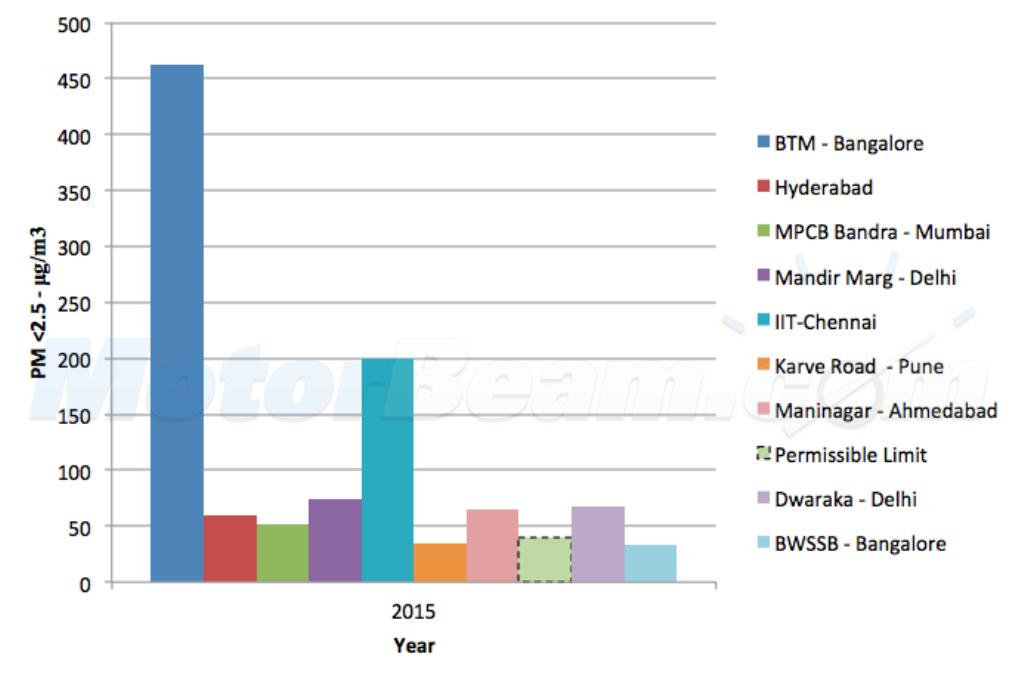
BTM area in Bangalore tops the rouge list again with 462 μg/m3 followed by IIT area of Chennai. However as claimed by agencies, Delhi doesn’t show a harsh bar for the particulate matter, as two areas of Delhi Mandir Marg and Dwaraka have reported 74 and 68 μg/m3 of PM 2.5. Rest of the other cities is more or less near the acceptable limits.
Conclusion – As per our study, Bangalore has undoubtedly topped the polluted cities’ list. Delhi, though maybe polluted, Bangalore is too ahead to be competed against. The third and fourth most polluted cities are Chennai and Ahmedabad respectively. The city with least polluted air is surprisingly Pune. Though the city is the heart of the automobile belt, the city still manages to score good points for air quality. MotorBeam thoroughly believes that the curb on usage of older vehicles should be applied to Bangalore too, sighting extremely poor air quality. It has to be noted that the values have been retrieved from authorised government websites, hence the values stay hold irrespective of what other agencies claim.
* Data of Kolkata, Surat, Kanpur, Jamshedpur, Sholapur and Agra not available on the referred website.